
Triggered Campaign Report
Reports on triggered and bulk campaigns are structurally similar, but there are some minor differences, mainly activity dynamics graphs.
In addition, the system has special features for convenient analytics of all messages participating in the workflow.
Activity Dynamics
The Activity dynamics tab shows the distribution rates in graphs over a certain period.
Performance
The Performance graph displays the following numbers for a selected period (on the example of the email channel):
- Delivered messages;
- Opened;
- Clicked;
- Unsubscribed;
- Reported as spam.
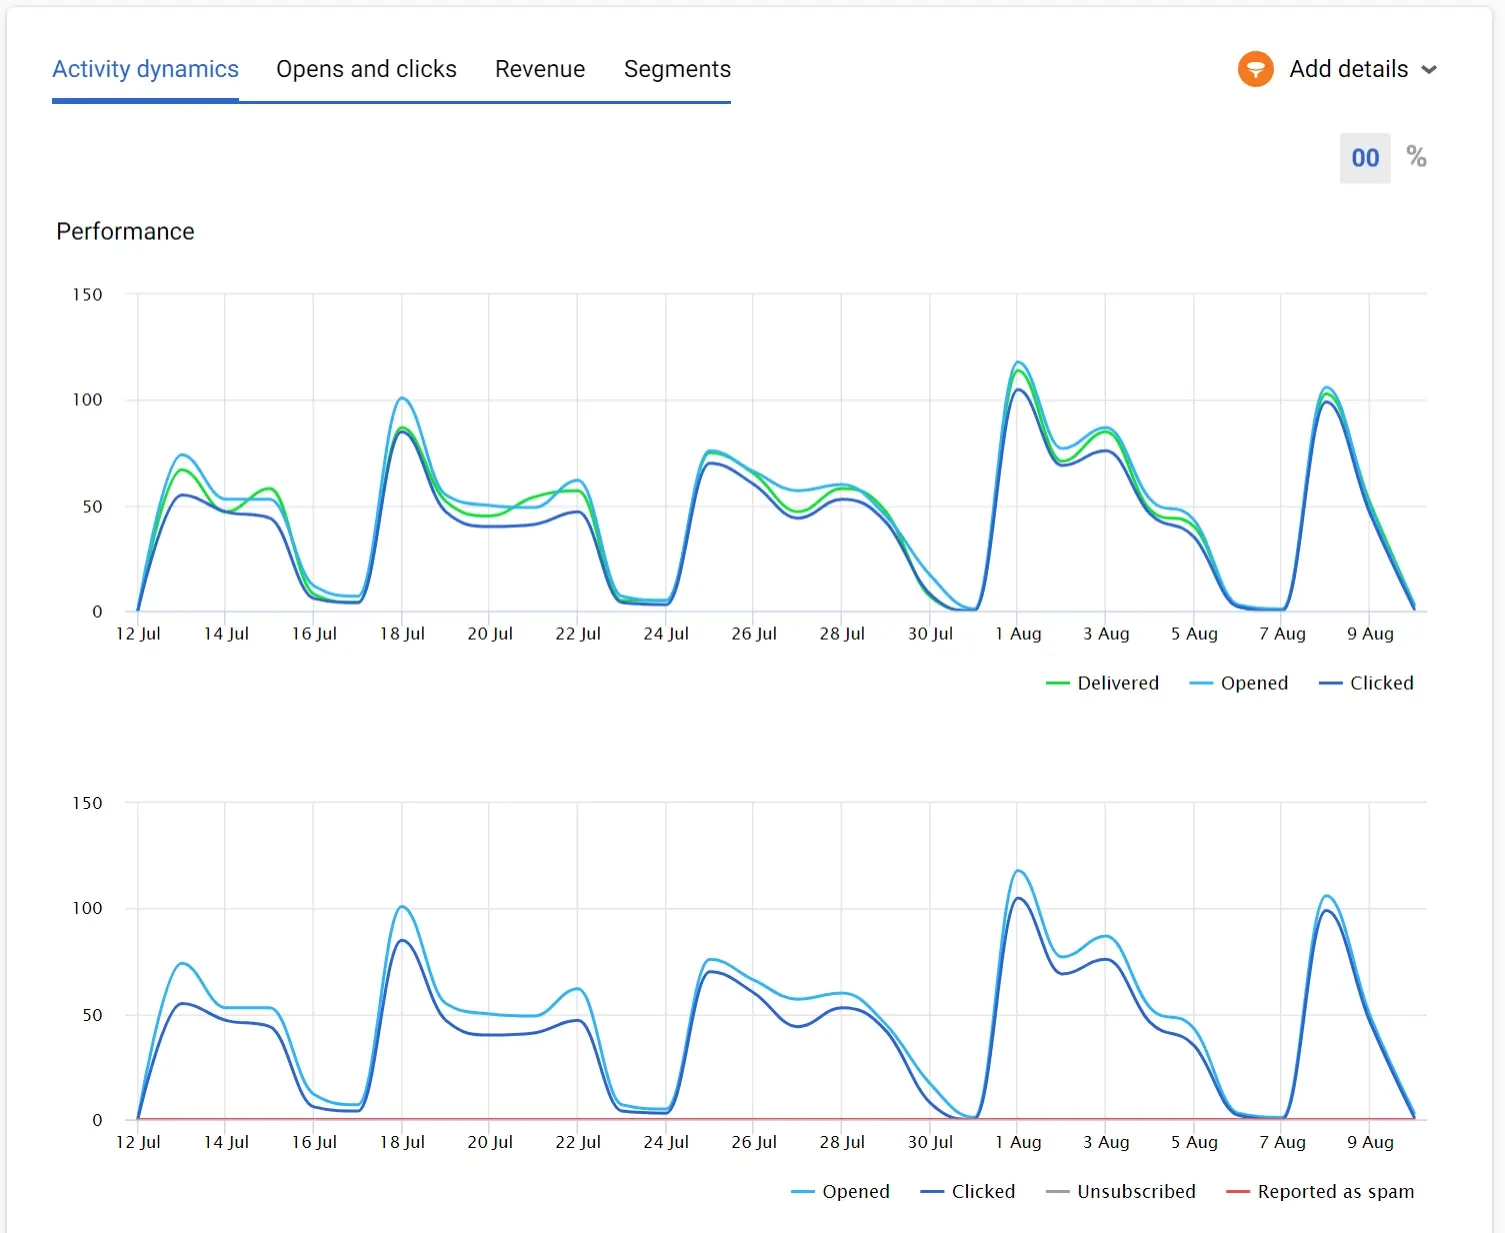
The number of indicators on the performance graph depends on the channel.
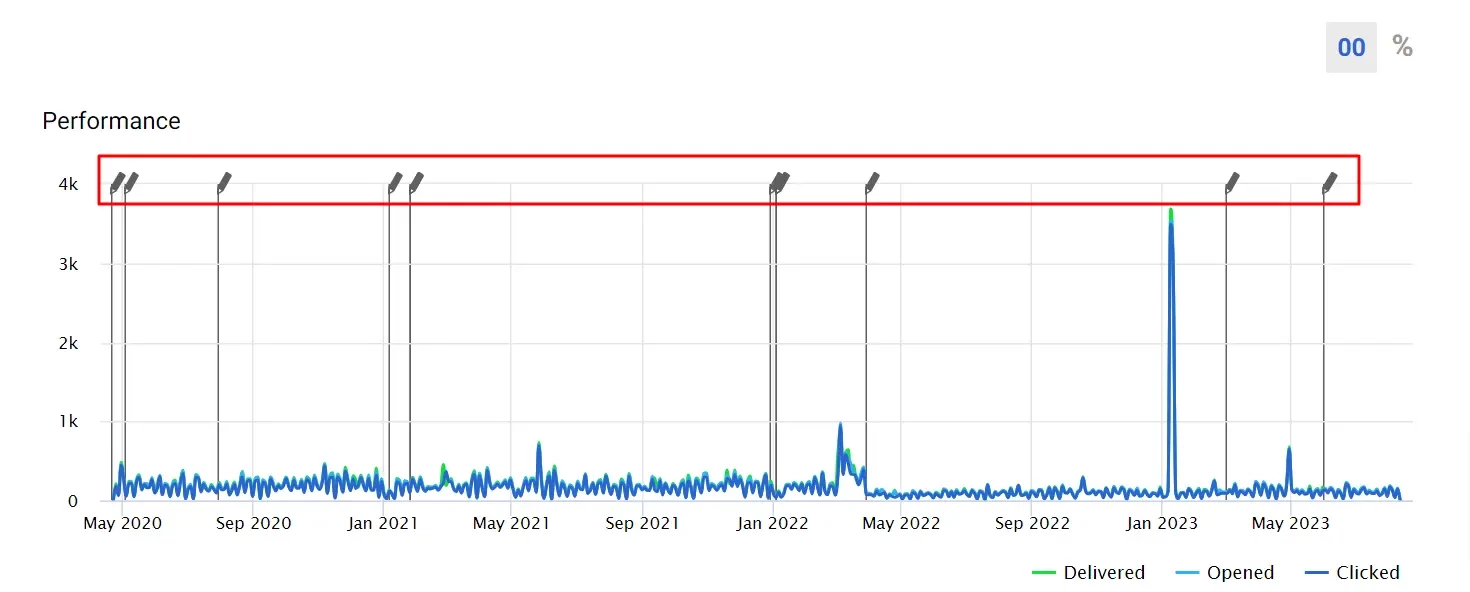
Hovering the cursor over the graph lets you view the exact time and number of openings and clicks for a certain period. The pencil on the graph shows when the message from the workflow was edited:
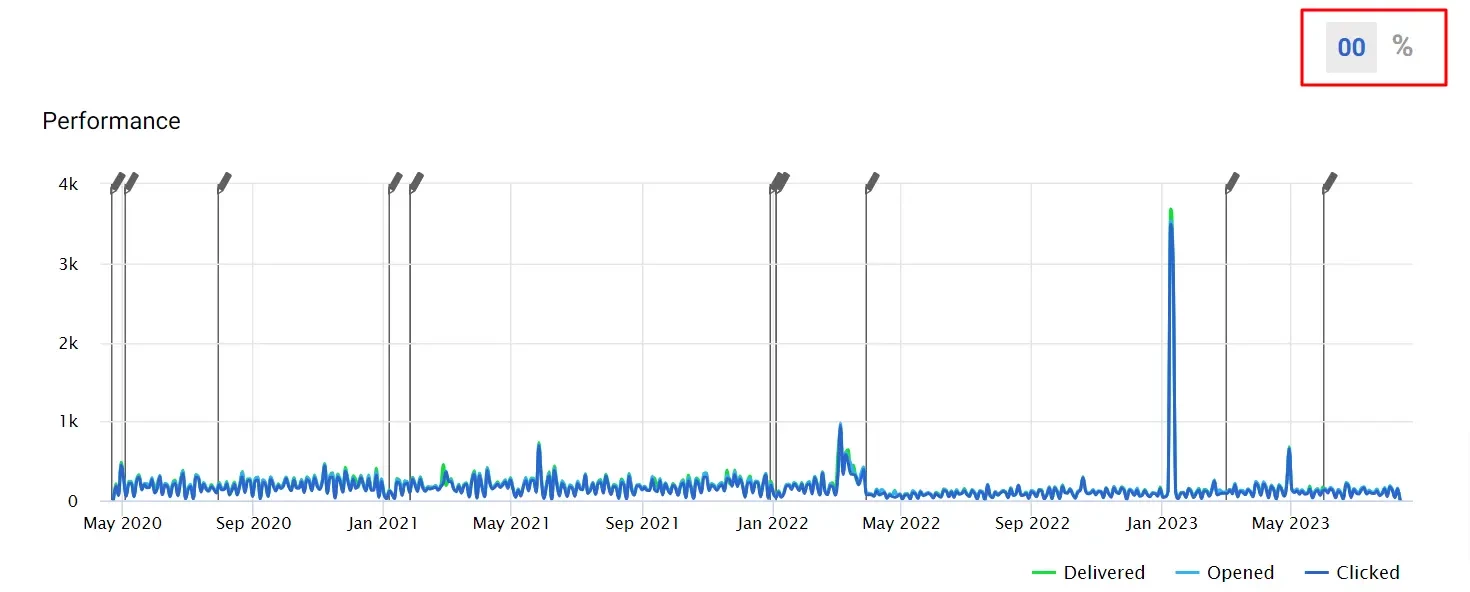
You can see the report data in relative and absolute values:
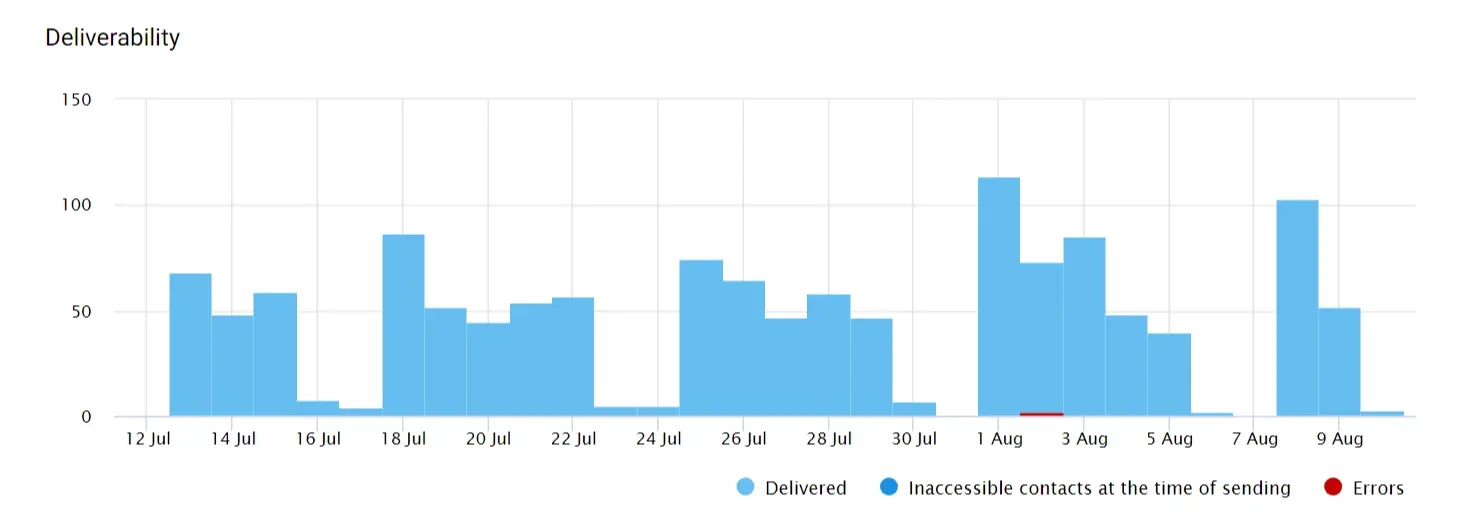
Deliverability
Below is a graph with deliverability rates, which is also based on the selected period. Here you can see indicators for:
- Delivered messages;
- Inaccessible contacts at the time of sending;
- Errors.
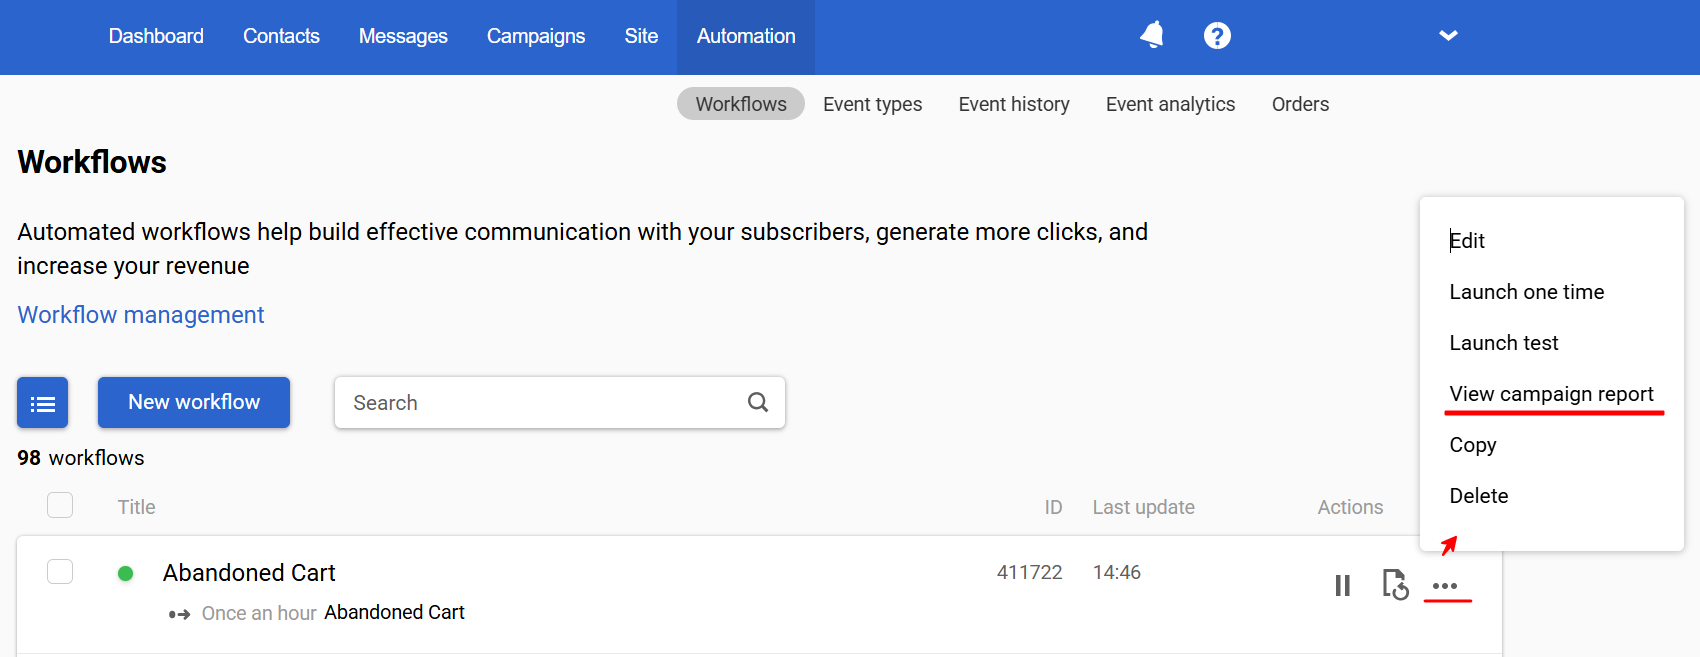
General Report on Workflow Messages
You can see all the messages participating in a particular workflow and their statistics. For this:
- Go to
- Automation → Workflows → View campaign report.
Or,
- Campaigns → Reports → Triggered → Select workflow.
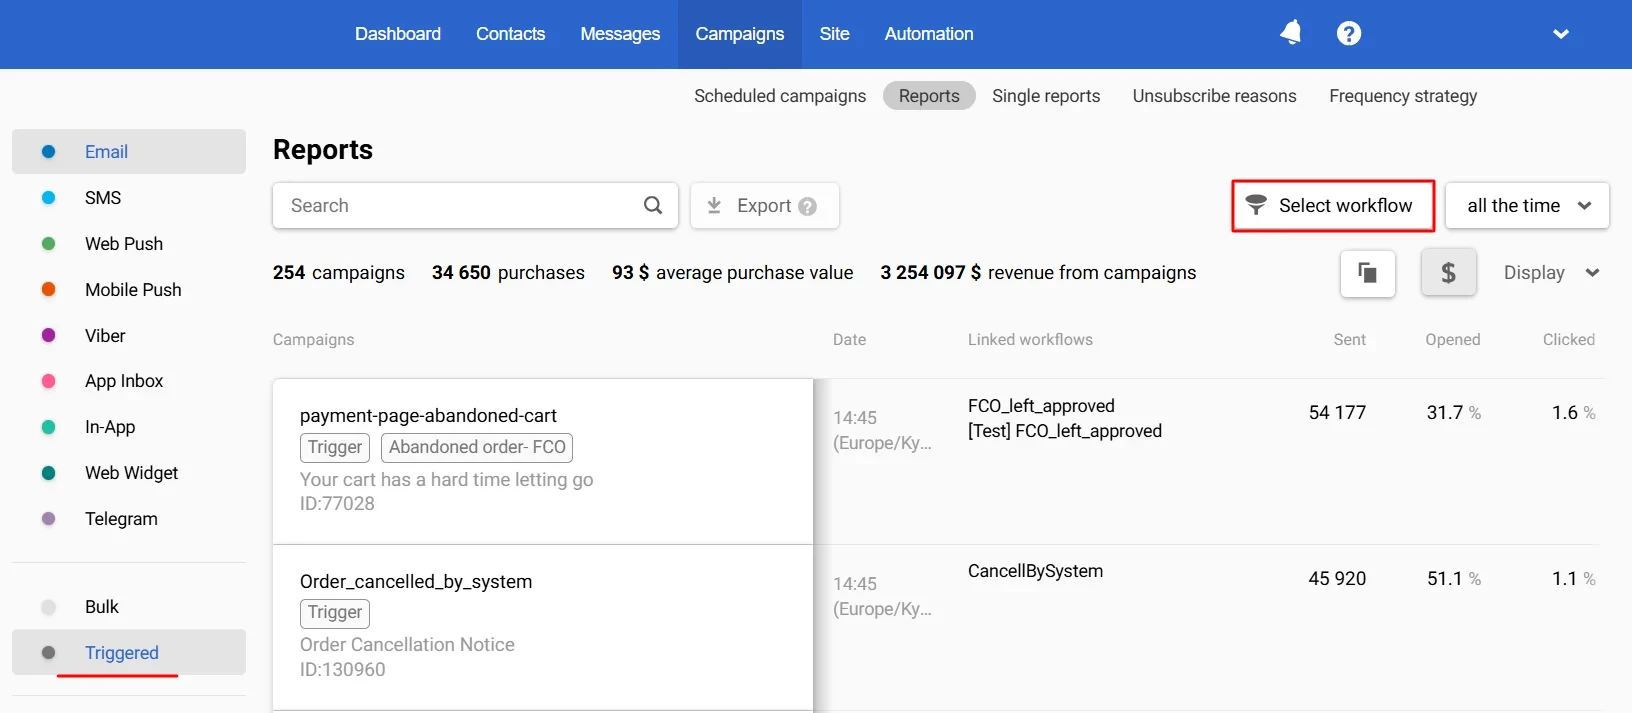
- On the screen with reports, select:
- Message media type (for omnichannel workflows)
- Reporting period
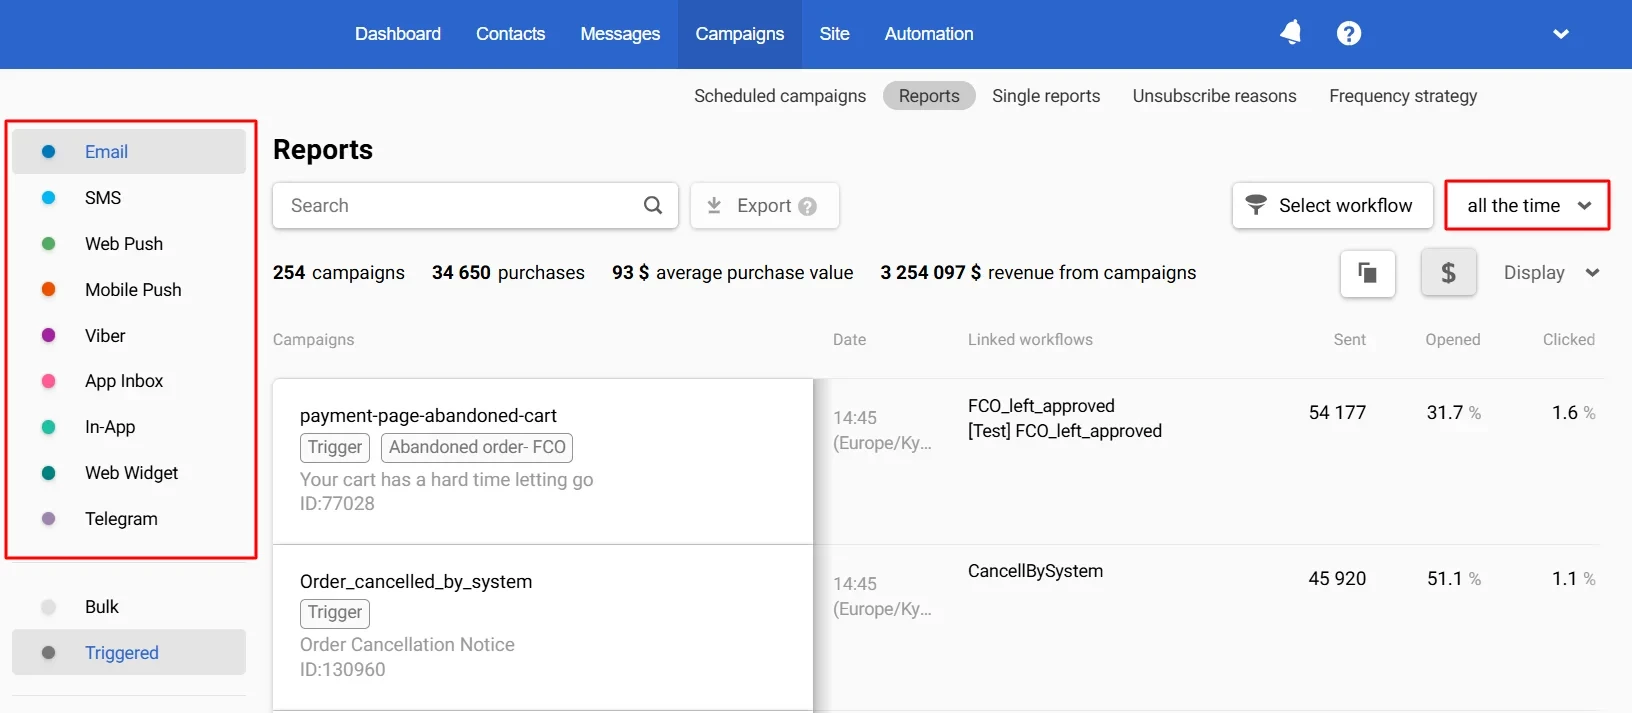
Statistics are exported according to the selected filters.
Note
You can easily see which workflows the messages are involved in:
- The list of trigger campaign reports displays the name of the workflow, clicking on which opens its preview;
- In the general information about each report, you can copy the workflow ID and open its preview;
- In the message preview, you can copy the workflow ID.
Updated 16 days ago